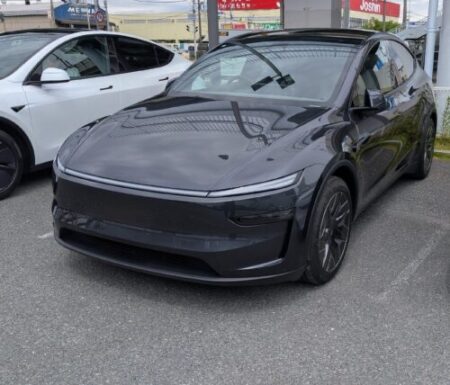
I have now logged six Supercharging sessions in the Model YL, screenshotting the Tesla app every time the state of charge moved, so this Tesla charging curve comparison finally has enough data to say something.
Starting states of charge were all over the place: 4%, 7%, 7%, 39%, 1.7%, 13%. Same car, all on 250 kW hardware. The curves still came out surprisingly different.
The fun part: the session that felt fastest turned out to taper first.
Tesla charging curve comparison: six sessions side by side
Peak is the highest figure I captured. “End of 250 kW” is the last state of charge where I still saw 250 kW or more.
| Item | Jul 23 | Aug 4 | Aug 5 | Aug 8 | Aug 9 | Aug 14 |
|---|---|---|---|---|---|---|
| Starting SOC | 4% | 7% | 7% | 39% | 1.7% | 13% |
| Charger | V3, 4 stalls | V4, 4 stalls | V3, 4 stalls | V3, 6 stalls | V3, 4 stalls | V3, 4 stalls |
| Preconditioning | unknown | yes | yes | yes | yes | no |
| Other cars charging | 1 | 1 later on | none | 1 | none | 1, then 3 (full) |
| Ambient | not logged | 35°C | over 30°C | not logged | not logged | 29°C |
| Start time | 20:42 | 15:02 | 11:28 | 17:23 | 01:03 | 19:44 |
| Preceding drive | 100 km motorway | 523 km motorway | 264 km rural | city only | 602 km no charge | 10 min from cold |
| Peak | 251 kW | 249 kW | 253 kW | 174 kW | 251 kW | 250 kW |
| End of 250 kW | seen to 10% | not reached | 22% | not reached | 18% | 16% |
| Power at 22% | 186 kW | not logged | 250 kW | n/a | 174 kW | 222 kW |
| Power near 25% | not logged | 118 kW (26%) | 155 kW | n/a | 137 kW | 210 kW |
| +20% took | 4:21, 221 kW (+18%) | not logged | 5:00, 183 kW (+18%) | 6:10, 133 kW (+16%) | 4:37, 227 kW (+20%) | 5:38, 186 kW |
| +25% took | not logged | not logged | not logged | 9:37, 122 kW (+23%) | 5:57, 202 kW (+23%) | 7:10, 182 kW |
| +35% took | not logged | not logged | 17:00, 129 kW (+43%) | 17:42, 104 kW (+36%) | not logged | 11:10, 164 kW |
| +50% took | 20:19, 133 kW (+53%) | not logged | 23:00, 117 kW (+53%) | 29:02, 83 kW (+47%) | not logged | 18:37, 140 kW |
| +60% took | not logged | 40:00, 87 kW (+67%) | not logged | 56:29, 55 kW (+61%) | not logged | 25:07, 125 kW |
The bottom five rows show how long it took to add that many points from the starting SOC, plus the average power over that stretch. Where I did not capture the exact percentage I used the nearest logged point, with the real increment in brackets. Anything more than 10 points away is marked as not logged. The Aug 4 session was unplugged then replugged, which reset the energy counter, so those figures count from 14%.
Screenshots are manual, so there are gaps. Peak power was around 250 kW in every session that started low. What separates them is what happens next.
Session by session, steepest taper first
Aug 4, Yamaguchi: 35°C ambient, down to 118 kW by 26%
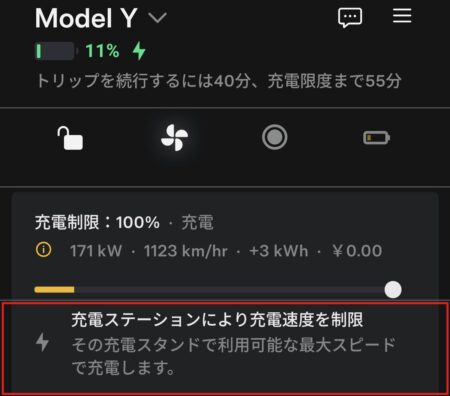
This was day one of the Kyushu trip, plugged in after 523 km straight from home, ambient 35°C (95°F).
The first stall capped out at 171 kW with a station limit notice, so I moved to the neighbouring stall, where it reached 249 kW at 14%.
Then it fell apart. Three and a half minutes later, at 26%, it was down to 118 kW. Compared at the same state of charge, that is over 40 kW below any other session.
The interesting footnote: after I switched the air conditioning off, it was still holding 120 kW at 50%. Output normally falls as the pack fills, so that counts as a recovery. Nothing showed the temperature effect more clearly than this session.
Aug 9, Otsu: straight off a 602 km run, 137 kW at 25%
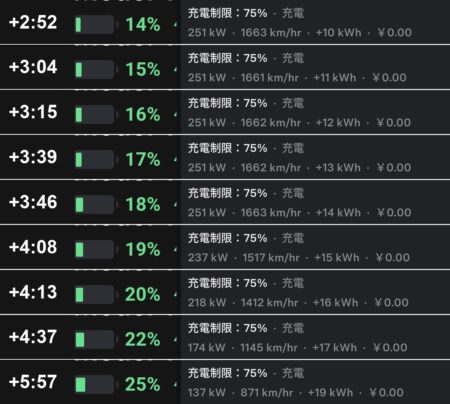
This one came at the end of the drive home, after covering 602 km without charging, arriving at 1.7%.
Each percent took about 15 seconds. By feel, this was easily the fastest of the six, with numbers changing faster than I could screenshot them.
The log says otherwise. The 251 kW figure held to 18%, then 174 kW at 22%, 137 kW at 25%. Of the sessions I logged properly, only Yamaguchi ended up lower. The drive that emptied the battery is written up in 602 km on one charge.
After 600 km the pack must have been thoroughly hot. You get the peak, then very little thermal headroom, so it gets throttled early. The session that felt fastest was the one tapering soonest, which I never would have noticed without the table.
Aug 5, Miyazaki: 250 kW held all the way to 22%
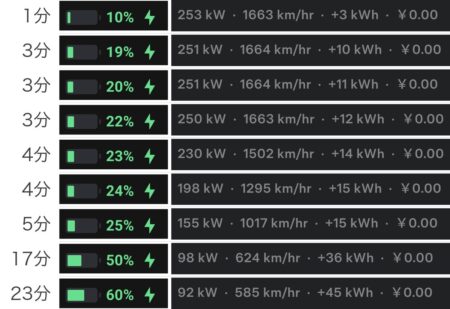
Miyazaki held 250 kW to 22%, the longest of the six.
It followed 264 km on the Higashi-Kyushu Expressway, much of it single carriageway at an average of about 70 km/h, so more of a cruise than a hard motorway run. No neighbouring cars either. On paper, the best conditions of the six.
Then came the cliff: 230 kW at 23%, 198 kW at 24%, 155 kW at 25%. Ninety-five kW gone inside three points. Hold the peak longer, meet the cliff sooner.
Aug 14: the coldest pack kept 210 kW at 25%
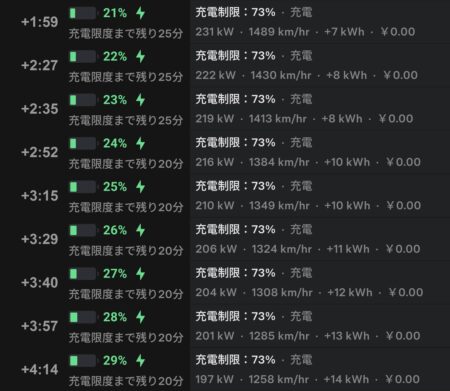
The opposite case is the 13% session on August 14, plugged in about ten minutes after setting off, no motorway running, no preconditioning, 29°C ambient after dark. The coldest pack of the six, logged percent by percent in supercharging without preconditioning.
It held 250 kW only to 16%, dead last on peak duration.
The taper was another story: 222 kW at 22%, still 210 kW at 25%. Against 155 kW at Miyazaki, 137 kW at Otsu, 118 kW at Yamaguchi, that is a different league at the same state of charge. No steps, no sudden drops, just a few kW shaved per percent, with nothing resembling heat limiting.
Aug 8, Kitakyushu: plugged in at 39%, capped at 174 kW
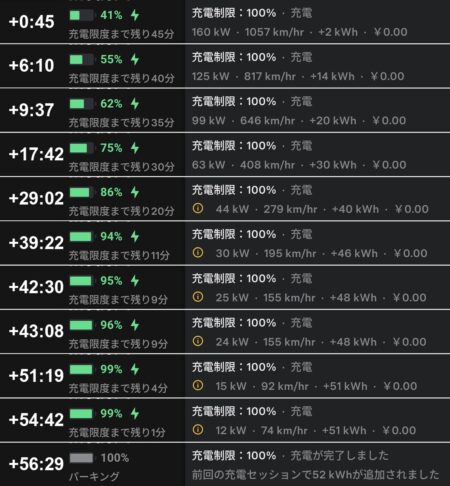
Kitakyushu is the odd one out, plugged in at 39%, well past the window where high power is available.
It opened at 174 kW, which was the ceiling for the day, then only fell. Preconditioning had run properly, only one of six stalls was taken, conditions were fine.
Going 39% to 100% took 56 minutes 29 seconds: 86% within the first 29 minutes, then 27 more for the last 14 points. A neat demonstration, from the wrong end, of how much arriving empty matters.
Buy the peak, or buy the taper
What this Tesla charging curve comparison shows is that peak duration works against late-session output.
Miyazaki held 250 kW longest, then sat at 155 kW by 25%. The 13% session barely held the peak at all, yet had 210 kW at 25%. The order flips completely.
July 23 sits on the same side: 100 km of motorway before plugging in, 186 kW at 22%, some 36 kW below the 222 kW of the cold session at the same point.
Which makes me think preconditioning buys peak power by selling the taper. Warm the pack first, the peak lasts longer, but charging heat pushes it into the limit sooner. Plug in cold, the peak is brief, yet the thermal headroom lasts. Yamaguchi recovering once I killed the air conditioning fits the same story: cooling capacity spent on the cabin was capacity unavailable to the pack.
Six sessions is not a controlled experiment. Occupancy, ambient temperature, time of day all vary, plus Yamaguchi was the only V4 site.
Even so, if you plan to charge past 25%, summer may favour skipping the preheat. That is the next thing I want to test, alongside the earlier Supercharger charging curve write-up on Tesla’s Supercharger network.
What I take from six sessions
- The five sessions starting in single digits to the mid teens peaked at 249 kW to 253 kW; Kitakyushu at 39% stopped at 174 kW
- Longest 250 kW stretch was Miyazaki at 22%, shortest was the 13% session at 16%
- By 25% the order inverts: Yamaguchi 118 kW, Otsu 137 kW, Miyazaki 155 kW, against 210 kW for the cold session
- The hottest conditions, 35°C ambient after 523 km, gave the worst curve
A low starting percentage does feel quicker, but that is because each point arrives faster, not because the curve is better. Temperature mattered more than state of charge.
Next I want winter data: plugging in at around 5°C (41°F) with no preconditioning. If the result reverses, the theory holds. I will be screenshotting every percent again. Longer-term efficiency numbers are in two months, 10,000 km in the Model YL.






This article is also available in Japanese.