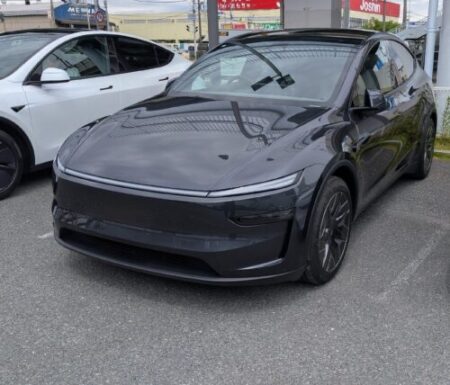
I plugged the Model YL into a 250 kW V3 stall at 7% state of charge with no preconditioning, which produced the clearest Tesla Supercharger thermal taper I have measured so far.
It was the night of 20 August 2026, 28°C (82°F) ambient. This was the fourth time I had plugged in from a single-digit state of charge, so I screenshotted the app at every percent to line it up against the previous three.
The headline number: still 235 kW at 25%. That is the best figure of anything I have logged.
Then it fell off a cliff, down to 105 kW by 34%. And instead of staying down, it climbed back.
An hour on back roads, an hour parked, then plugged in
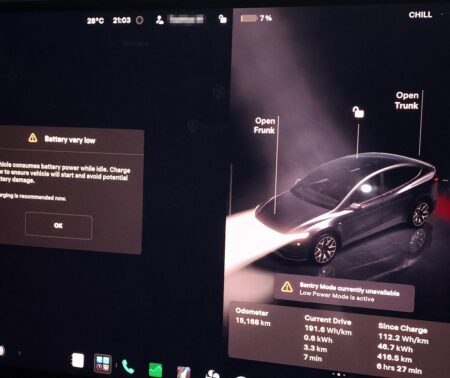
The screen (in Japanese) reads: exterior temperature 28°C, battery very low, sentry mode disabled to save power.
Ambient 28°C, 7% left. The battery very low warning was up, low-power mode had already shut sentry mode off.
The odometer read 15,168 km. Since the last charge I had covered 416.5 km on 46.7 kWh, which works out at 112.2 Wh/km.
What came before the charge: roughly an hour on ordinary roads at legal speeds, then about an hour parked. After that, 3.3 km, seven minutes, to the Supercharger.
So the pack was neither baked by hundreds of kilometres of motorway nor fully cold. That hour parked will have let some heat out.
I skipped preconditioning deliberately, by not setting the Supercharger as a navigation destination.
The stall was a V3 rated at 250 kW, on the Tesla Supercharger network. Mine was the only car on site, so nothing was sharing power with me.
251 kW held to 19%, still 235 kW at 25%
Seventeen seconds after plugging in, it hit 251 kW.
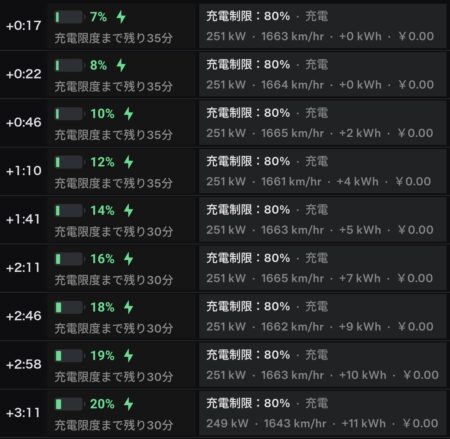
The app (in Japanese) reads: charge limit 80%, charging, 35 minutes remaining to the charge limit.
It stayed at 251 kW all the way to 19%. Then 249 kW at 20%, 248 kW at 21%.
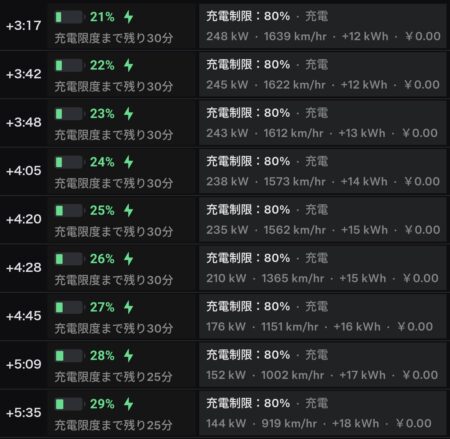
The app (in Japanese) reads: charge limit 80%, charging, 30 minutes remaining to the charge limit.
245 kW at 22%, 243 kW at 23%, 238 kW at 24%, 235 kW at 25%. Only two to five kilowatts shaved off per percent.
Reaching 25% took 4 minutes 20 seconds for 15 kWh, an average of 208 kW.
My 13% session with no preconditioning managed 210 kW at 25%, so this beat it by 25 kW. Miyazaki was 155 kW, Yamaguchi only 118 kW at 26%. Around the 25% mark, this session is clearly ahead.
From 26% down to 105 kW, back up to 119 kW by 52%
That was the end of the fun.
210 kW at 26%. Each 1% of progress cost 25 kW, more than five times the rate up to then.
176 kW at 27%, 152 kW at 28%, 144 kW at 29%.
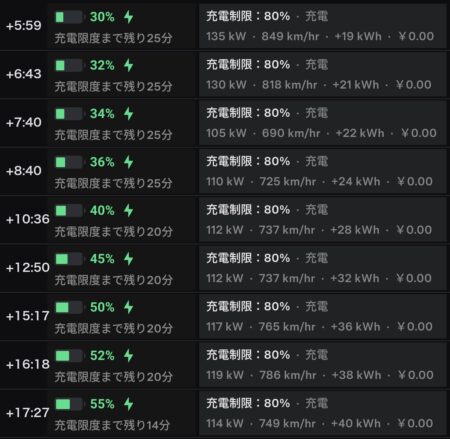
The app (in Japanese) reads: charge limit 80%, charging, 25 minutes remaining, then 20 minutes remaining to the charge limit.
135 kW at 30%, 130 kW at 32%, then 105 kW at 34%. Eight percentage points, 3 minutes 12 seconds, 105 kW gone.
Not one notice about the site limiting charging speed appeared during any of it. When another car has shared the site with me before, that message showed up properly. This time I had the place to myself.
Tesla Supercharger thermal taper, then a recovery
Which points to heat. The pack took 250 kW for four and a half minutes, cooling could not keep up.
The interesting part is what happened after the drop.
111 kW at 35%, 110 kW at 36%, 112 kW at 38%. It bottomed out at 105 kW, then started creeping back.
112 kW at 45%, 117 kW at 50%, 119 kW at 52%. Fourteen kilowatts recovered from the floor.
Power is supposed to fall as state of charge rises, so this shape is not a normal charging curve. Cooling catching up, lifting the ceiling again, is the obvious reading.
It finished at 114 kW at 55%: 40 kWh in 17 minutes 27 seconds.
I stopped at 55% because I wanted to get home, because I only wanted the efficient part of the curve. Enough for the next day was enough.
Past that point each percent takes over 40 seconds, which is not worth waiting around for.
Lined up against the similar sessions
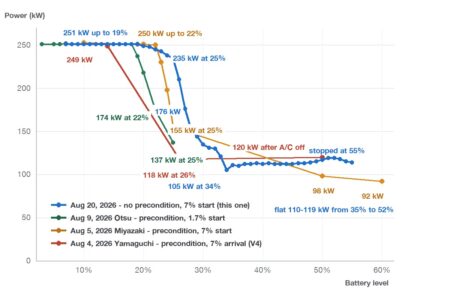
Four sessions started in the single digits on 250 kW hardware. Here they are overlaid, then as numbers.
| Item | Aug 20, this session | Aug 9 Otsu | Aug 5 Miyazaki | Aug 4 Yamaguchi | Jul 23 |
|---|---|---|---|---|---|
| Starting SOC | 7% | 1.7% | 7% | arrived at 7%, plugged in at 11% | 4% |
| Charger | V3 | V3 | V3 | V4 | V3 |
| Preconditioning | no | yes | yes | yes | unknown |
| Other cars charging | none | none | none | 1 later on | 1 |
| Ambient | 28°C | not logged | over 30°C | 35°C | not logged |
| Start time | 21:04 | 01:04 | 11:28 | 15:02 | 20:42 |
| Preceding drive | 1 h back roads, 1 h parked, 3.3 km | 602 km no charge | 264 km rural | 523 km motorway | 100 km motorway |
| Peak | 251 kW | 252 kW | 253 kW | 249 kW | 251 kW |
| End of 250 kW | 19% | 18% | 22% | not reached | seen to 10% |
| Power at 22% | 245 kW | 174 kW | 250 kW | not logged | 186 kW |
| Power near 25% | 235 kW | 137 kW | 155 kW | not logged, 118 kW at 26% | not logged |
| Power at 50% | 117 kW | not logged | 98 kW | 120 kW, after the aircon went off | not logged, 112 kW at 57% |
| Stopped at | 55% in 17:27, 40 kWh | 25% in 5:57, 19 kWh | 60% in 23:00, 45 kWh | 81% in 40:00, 58 kWh | 57% in 20:19, 45 kWh |
| Time to add SOC / average power | |||||
| +20% | 4:45, 210 kW | 4:37, 227 kW (+20%) | 5:00, 183 kW (+18%) | not logged | 4:21, 221 kW (+18%) |
| +25% | 6:43, 186 kW | 5:57, 202 kW (+23%) | not logged | not logged | not logged |
| +35% | 11:30, 152 kW | not logged | not logged | not logged | not logged |
| +50% | 17:27, 138 kW (+48%) | not logged | 23:00, 117 kW (+53%) | not logged | 20:19, 133 kW (+53%) |
| +60% | not logged | not logged | not logged | 40:00, 87 kW (+67%) | not logged |
The bottom rows say how long it took to add a given number of percentage points from the starting state of charge, with the average power over that stretch. Where I did not capture the exact percentage I used the nearest logged point, with the real increment in brackets. The app only counts energy in whole kilowatt-hours, so the added figures come from each session’s total divided by the percentage gained. Assume a few kilowatts of error.
Yamaguchi is the session where the stall I picked capped out at 171 kW, so I moved to the next one, which gave 249 kW. The energy counter reset there, which is why the 25% area is missing.
Otsu came straight after covering 602 km without charging. It held 251 kW to 18%, then 174 kW at 22%, 137 kW at 25%. At 22% it is the lowest of the group.
The longer you hold 250 kW, the less you have left
Lined up like this, the length of the 250 kW plateau tracks inversely with what comes after.
Miyazaki held 250 kW to 22%, then gave 155 kW at 25%. Otsu held to 18%, then 137 kW. This session dropped off the plateau at 19%, yet still had 235 kW at 25%.
Otsu wins the first half, this session wins the second
Look at the average-power rows: Otsu is fastest early, adding 20 points in 4 minutes 37 seconds at an average of 227 kW. This session took 4 minutes 45 seconds at 210 kW, so it loses narrowly.
Include the back half, though, and it flips. At 50% state of charge Miyazaki was on 98 kW, this session on 117 kW.
Early speed is one thing. Speed once you charge past 25% is another.
I would trade 250 kW for a curve that never heat soaks
Watching this, I started wondering whether 250 kW is worth having at all.
The first half here held 251 kW beautifully. The bill arrived from 26% onward, dropping to 105 kW across eight percentage points.
Taking maybe 200 kW from the start, never touching the thermal ceiling, might well be quicker over the whole session. A lower peak is nothing to brag about, but the person sitting in the car would rather have it.
Heat soak cannot be good for the pack
Pushing the cells hard enough to hit a thermal limit seems unlikely to do them any favours. I cannot cut down on fast charging, so I would at least like the heat to go in gently.
The only lever I have is where I start
The one thing under my control is the starting state of charge. Plug in around 25% with no preconditioning, spend less time absorbing 250 kW. The catch is that it leaves less usable range, which is awkward on a long trip.
Set a target, let the car work it out
What I would really like is for the car to handle this. Tell it what percentage I need, separately from the charge limit, then let it manage the rate so heat never becomes the constraint. With a target state of charge, ambient temperature, pack temperature, charger type, it should all be calculable. An OTA update with that setting would be very welcome.
What I take from the fourth single-digit session
Five things came out of this Tesla Supercharger thermal taper:
- 251 kW arrives even without preconditioning; here it lasted to 19%
- 235 kW at 25% is the highest of seven logged sessions, well clear of Miyazaki on 155 kW with preconditioning, Otsu on 137 kW
- The price was a sharp fall from 26%, down to 105 kW by 34%
- It did not stay down: 119 kW by 52%, which looks like cooling catching up
- For average power to add 20 points, Otsu is still fastest at 227 kW; at 50% state of charge this session led with 117 kW against 98 kW
Summer with no preconditioning is a good combination if you stop around 25%. Charge past that, expect a dip along the way.
Next I want to plug in around 25% with no preconditioning, to see whether shortening the time spent at 250 kW removes the drop altogether.
Then winter. Doing the same thing at around 5°C (41°F) should produce a completely different curve. I will be screenshotting every percent again. The full picture across every session so far is in my charging curve comparison.




This article is also available in Japanese.